


Инвестор или спекулянт ?
Инвестор + спекулянт !
Стратегия усреднения
Приложение


Описание:
Не требует регистрации.
Поддерживаемые языки: Английский, Немецкий, Русский
Экран инструментов
- Формирование списка приобретённых инструментов фондового рынка.
- Показ текущего и наилучшего показателя средней цены из расчетов таблицы сделок.
Экран таблицы сделок
Таблица производит расчет средней цены и других показателей по записям сделок, включая полные продажи и короткие позиции, с учетом комиссий, налогов, дивидендов, прочих расходов и доходов.
Вывод основных расчетных показателей по инструменту: количество инструмента, средняя цена, стоимость актива, текущая прибыль относительно текущей цены на бирже
- Удобное добавление записей в таблицу по осуществленным сделкам, полученным дивидендам, прочим расходам по инструменту.
- Расчет дивидендов и дивидендной доли в процентах относительно средней цены.
- Возможность редактировать входные данные в таблице, вставлять и удалять строки, а также сокращать таблицу при чрезмерном увеличении.
Экран расчета
- Обзор 3D-графика зависимости Avg = f (Q, P) - средней цены (Avg) от количества лотов (Q) и цены на инструмент (P) позволит наглядно выбрать точку для покупки или продажи инструмента.
- Интерактивный расчет одного из параметров путем изменения остальных при планировании сделки.
- Расчет планируемой суммы операции покупки или продажи.
- Расчет кредитной суммы при продажах с короткими позициями.
- Возможность выставлять лимит суммы для покупки или продажи.
Экран настроек
- Смена языков: Английский, Немецкий, Русский
- Установка пароля для входа
- Возможность экспорта и импорта данных.
- Выбор отображения количества инструмента в штуках или лотах.
- Обратная связь с разработчиком
Встроенная справка
Каждое окно в приложении содержит встроенную справку с описанием функционала окна.
Приложение Investcalc поможет инвестору рассчитать средние цены приобретенных инструментов в биржевой торговле (акции, фьючерсы). При этом учитываются все совершенные сделки, выплаты дивидендов, комиссии и прочие расходы. Позволяет наглядно увидеть прогресс изменения средней цены. Предоставляет трехмерный график зависимости таких параметров как: средняя цена, количество лотов и цена лота с возможностью интерактивного расчета любого из параметров по изменению других.
МОБИЛЬНОЕ ПРИЛОЖЕНИЕ INVESTCALC
О приложении
ЭКСТРЕМАЛЬНАЯ СТРАТЕГИЯ УСРЕДНЕНИЯ С ПОМОЩЬЮ INVESTCALC APP
Экстремальная стратегия усреднения описана здесь.
1. Совершив достаточно крупную покупк�у пакета дивидендных акций в свой портфель, делаем запись в таблицу приложения. В примере было куплено 100 лотов по текущей цене 88.
В таблице получаем строку сделки со средней ценой 88. В данном примере расчет выполняется без учета комиссий при сделке, в противном случае же средняя цена после расчета оказалась бы немного выше.

2. Достигнув точки продажи на предполагаемом пике графика, в примере 92.5 делаем расчет необходимого количества бумаг для продажи в приложении переходом по кнопке "Расчет".
Указываем в окне расчета желаемую цену продажи
(P = 92,5).
Цель расчета - выяснить какое количество акций потребуется для продажи чтобы расчетная средняя цена была ближайшая к 0 (в примере условимся что не отрицательная)
Выставляем галочку над расчетным параметром - средней ценой Avg.
Прокручиваем ползунок количества акций в сторону уменьшения со знаком "-" (продажа) в значении до тех пор пока поле расчета средней цены не покажет нам минимальную цену, близкую к 0 (не отрицательную по нашему условию).
В расчете получаем среднюю цену 2,5 в валюте продажи, при этом окно количества показывает нам величину в "-95" лотов. Это то количество бумаг, при заданной цене, необходимо для продажи, чтобы средняя цена оставшегося акций была близка или равна 0.
При количестве на 1 лот больше (-96) средняя станет отрицательной (-20) что тоже было бы отлично и означало, что мы уже получим сверхприбыль с каждого лота остатка в размере 20 единиц валюты.


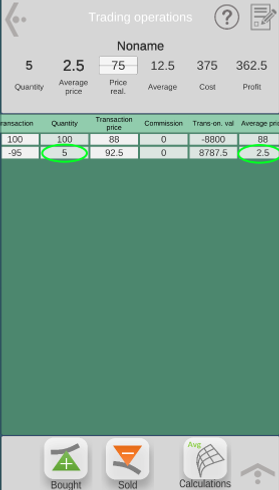
Совершив продажу, добавляем строку в таблицу по цене сделки для расчета внутри таблицы.
Возможно текущая цена продажи будет отличаться от желаемой и количество сделок может быть больше одной и по разным ценам (тогда заносится несколько строк в таблицу).
В результате продажи имеем в остатке 5 лотов акций по незначительной средней цене 2,5

3. В точке предполагаемой покупки 75 (ниже цены продажи или в нижнем пике графика в канале) можно сделать расчет необходимого количества лотов, исходя из полученной выручки при продаже или желаемой суммы.
Для примера, мы используем вырученную сумму от продажи, которая по таблице составляет в валюте 8767,5.
В окне расчета внизу отмечаем галочку ограничения суммы, вводим желаемую сумму покупки.
Выбираем "-" по кнопке (покупка).
Выставляем цену 75 и галочку изменения средней цены.
Вращаем ползунок лотов на увеличение, пока не появится зеленый индикатор (где красная стрелка) достижения условия по лимиту суммы. При этом счетчик лотов прекратит изменение.
Полученное количество вернется на шаг назад как на следующем экране, что и будет являться расчетным значением.


4. Повторяя методику пункта 2 и 3 постепенно накапливаем необходимое количество акций инструмента со средней ценой близкой к 0.
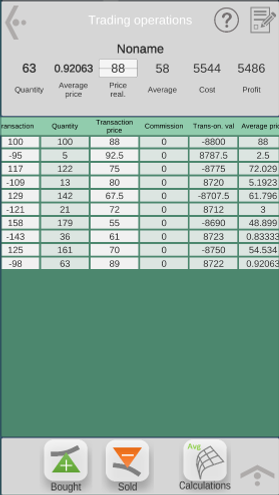
В нашем примере, на 10 пункте сделки мы имеем 63 лота по цене средней 0,92063.
Далее в окне списка инструментов под именем Noname видим что последняя операция была продажи (-98), после которой мы имеем в наличии 63 лота со средней 0,92063.
Цифры 179 и 48,899 означают, что до этого в таблице лучшей комбинацией (по средней и количеству) было 179 лотов со средней 48,899.
При этом лучшая комбинация не может иметь количество лотов меньше текущей.
Подкрашенная зеленым цветом средняя цена показывает, что последняя сделка имеет лучший результат по таблице.


КАК ИСПОЛЬЗОВАТЬ ГРАФИК ТРЕХ КЛЮЧЕВЫХ ПАРАМЕТРОВ СДЕЛКИ

ПРИМЕР РАСЧЕТА ПОКУПКИ
Дано:
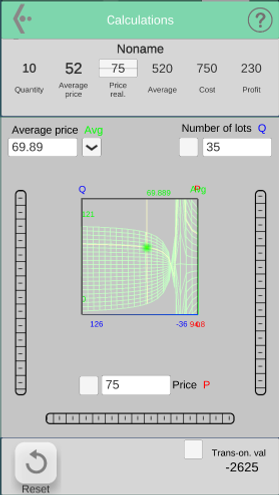
Количество акций - 10
Средняя цена - 52
Текущая цена - 75
Задача: расчет выгодной сделки покупки.
Решение:
Здесь обратная зависимость, чем в примере с продажей выше. Зеленый - выгодный отрезок покупок с практически линейной характеристикой изменения средней цены.
На этом участке средняя изменяется с меньшей скоростью и стремится к цене покупки 75, но не превысит ее при любом количестве в сделке.
Получаем что, от количества покупки, равным примерно 35 и больше, мы получили бы выгодный результат по соотношению количества и изменению средней цены. При 35 средняя цена будет равна 69,89.


ПРИМЕР РАСЧЕТА ПРОДАЖИ
Дано:
Количество акций - 40
Средняя цена - 72,25
Текущая цена - 79
Задача: расчет выгодной сделки продажи.
Решение:
Зависимость средней цены при фиксированной цене (выше средней) продажи от количества инструмента представляет собой кривую нелинейной зависимости.
Кривую можно разделить на 3 отрезка (смотри рис. справа): зеленый - позиция покупок, желтый - переходный отрезок позиции продаж, оранжевый - выгодный отрезок продаж с крутой характеристикой изменения средней цены.
Используя ползунок изменения количества в сделке, передвинем меркер на начало оранжевого участка.
Получаем что, от количества продажи, равным (-30) и ниже, мы получили бы лучший результат по изменению средней цены. При -30 средняя цена будет равна 52.
Учитывая текущее количество 40 штук и необходимость остатка, наиболее выгодными будут продажи от 30 до 39 штук
При максимальной продаже с остатком (-39) цена средней остатка (1) будет равна (-191). Самое близкое к нулю положительное среднее (11,5) будет при количестве -36.
Математически, переход в short (-41), вначале сильно увеличит среднюю цену (349). А например, при продаже в short на двойную величину (-80) средняя будет 85,75.